Article 7 – Lifecycle Data Analysis Requirements and Opportunities

This is the penultimate and seventh of short series of eight articles that aims to better define the requirements, limitations and opportunities that can be presented with a well-conceived Digital Mobility Platform (DMP) (Formerly MaaS).
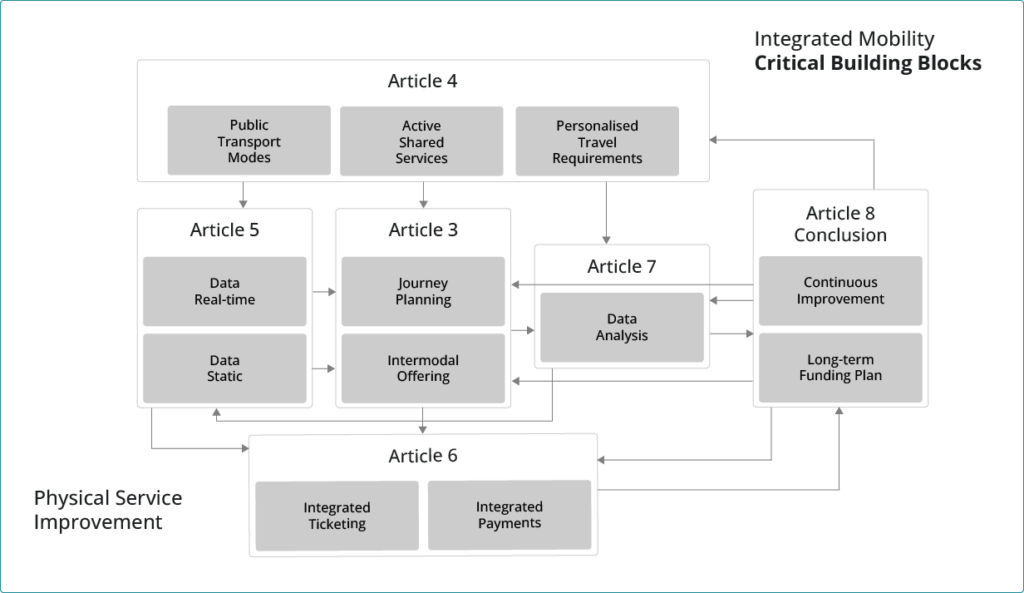
Perhaps the biggest misconception of MaaS platforms is that “it’s only an app”. This article will hopefully quell that notion and at least articulate if not demonstrate when starting your DMP journey, your mindset should be much broader, much more aligned and focused on the transport service being provided, and much more aware of how your DMP platform could help support the delivery of better, faster, more robust and more available transport for your customer base. Which of course will also lead to better service utilisation, less private vehicle miles travelled, and therefore link to your decarbonisation goals, not to mention the significant advantages one can yield from harvesting detailed operational data, and trend analysis to better understand the movement of people. However, this as it would suggest, would need to be a much bigger programme, covering multiple services from land-use planning, highways, bus operation improvement etc. This article will try to demonstrate what could be possible with the right mindset. But with the right data demonstrating a body of evidence, in the longer-term that should be possible.
Some of the Data That Should be Available
The graphic below shows at least some of the data that should be made available form your DMP. In this graphic it is divided into four categories, covering public transport operations, actual DMP analysis, hosting services and financial, however, your own system might categorise these differently, with fewer or more defined swim-lanes.
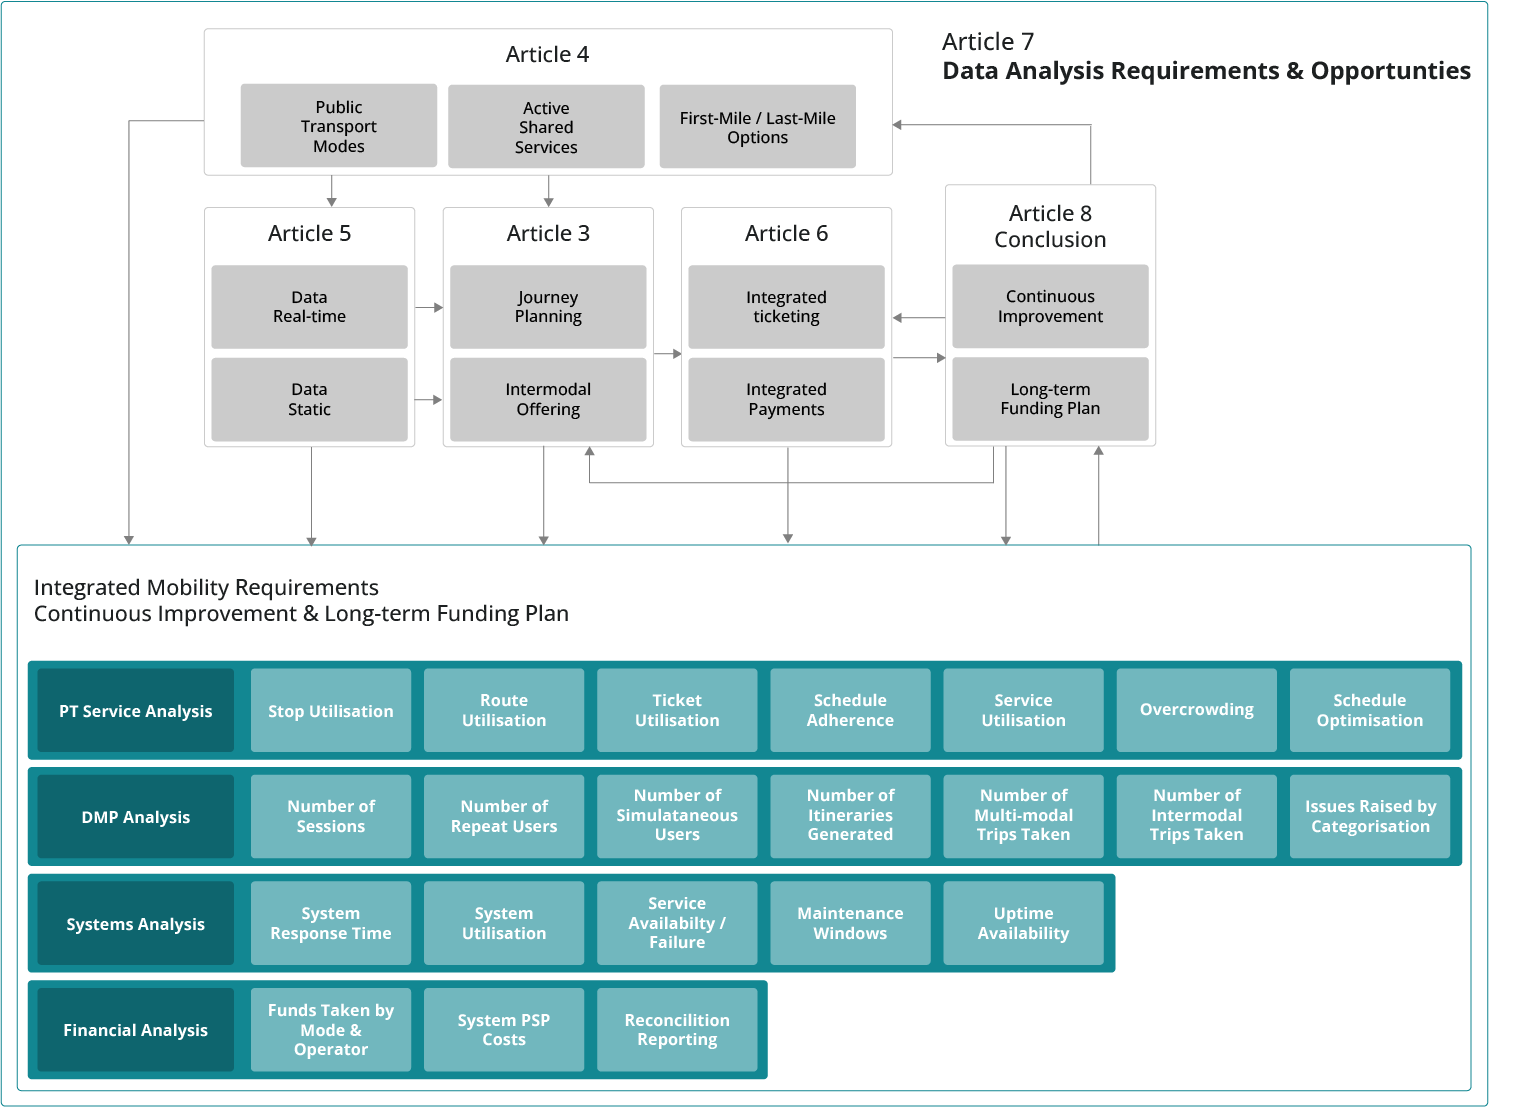
This article will concentrate mostly on the public transport operational analysis. If structured correctly, your DMP will provide a wealth of public transport utilisation, service and trend analysis data that has in most places hitherto been unavailable. Pockets of data may have existed for a single operator, but one of the overriding benefits of your DMP, is it could provide complete and holistic data across the entire network, enabling you for perhaps the first time to better understand how services coexist together, where bottlenecks may be occurring, where and when overcrowding is occurring, and potentially provide a range of options of how to overcome some of the problems that could make your transport network even better.
Service Improvement Data
Overcrowding: Of course, the one data source that is often unavailable is passenger counts, but with your modern DMP, even if that isn’t available, you should be able to analyse ticket utilisation, and/or open loop scan events using data fusion techniques. The naysayers amongst us will already be reaching for their pens to point out that many if not most ticketing solutions do not provide point-to-point analysis, and only point-to-point ticketing or tap-on/tap-off open loop systems can provide this level of accuracy. This is of course true, but through a body of data it is possible even within the guidelines of GDPR to reasonably accurately identify origin “and” destinations – certainly more accurately than the data we have generally previously had access to.
This analysis also goes hand-in-hand with trying to identify overcrowding events. Again, with the lack of Automatic Passenger Counters (APC’s), overcrowding events capture would largely be as a result of driver feedback, either through their manual communications channels or digitally through a drivers on-vehicle DMU (Data Management Units).
Stop Utilisation for onboarding events is reasonably straightforward, as one can collect that data from ticket scan data. However, for offboarding one would need to refer to the same data analysis as was discussed in the overcrowding section. If users agree to in-app tracking which can also lead to better transport disruption information which is a major advantage of your proposed DMP, this is reasonably simple, if not, utilising journey pairs to better understand origin-destination activities, is an option that should be explored.
Stop utilisation data if used correctly should in of itself be able to identify when overcrowding events could take place and could also indicate relationships between different public transport services, to provide a better understanding of stop, service and even network utilisation.
Schedule Adherence: Possibly one of the simplest ways of identifying the level of service confidence to your users is understanding the difference between the scheduled service and the actual services that are running. With accurate data now available from your DMP, which can automatically compare a schedule against actual real-time location, its reasonably easy to identify what proportion of services are running within a threshold, when compared again the schedule. With a statistically representative body of data, it is also possible to identify the level of change to the schedule that would need to be undertaken to better support on-time running. Or alternative measures which is where your DMP really comes into its own, by identify where and when traffic reduction activities should be implemented to smooth peak hour disruption events as an example. As per the opening paragraphs this would require a multi-disciplined team to collectively address traffic to better support the health, livelihood, and economic success of the wider community, which could include a number of stakeholders, including land-use planning, UTMC’s to better prioritise and therefore support public transport utilisation.
Schedule Optimisation: With this rich level of data made available in a single repository, it’s understandable that this data if analysed properly and then used correctly could identify where service and schedule improvements could be implemented. But with your new DMP, the objective must be how, where and when the service could and perhaps should be improved. Public transport is unfortunately often portrayed as being inconvenient, the level of data that should be made available from your DMP makes it easier to analyse where and when services are required, which in turn provides an opportunity for improvement. It’s logical to extrapolate service improvement with service utilisation, and therefore the more convenient a service is, the more utilisation that the service is likely to attract.
Revenue Collection
The success of your DMP may be seen as the direct correlation of the funds collected through the app. But this will depend heavily on what ticketing solutions you utilise in your region, for example if you have an open loop system where a bankcard is your token to ride, it’s very unlikely that funds will go through your system. Likewise, if there is a closed loop card system it’s unlikely that only a reasonably small percentage of transactions will go through your DMP.
Our advice to you, is not to concentrate on the revenue collection, but rather concentrate on the numbers of itineraries rendered, the number of downloads, user retention, utilisation by week/by user – which will provide a much better metric than revenue collection.
Not Covered in This Article
Whilst truly important, we’re conscious that within this article we have not covered either intermodal (integration of public and private modes for mixed mode itinerary options), nor micro mobility data integration. Both of which should be seen as critical components to help develop your own first-mile/last-mile strategic approach. Both offer valuable tools to aid the delivery of your traffic, reduction, carbon reduction, health community, active community, and urban planning strategies, to name but a few of the stakeholders that need these tools to enable strategic change. These items will be covered a little more in the final conclusive article, and we will at some time come back to these elements as these could and perhaps should be seen as being the bedrock that could enable true behavioural change.
Conclusion
Your DMP will provide to you a wealth of data that has probably not previously been available. But just having data doesn’t make it useful. It’s only through data analysis and digging into the data and trying to better understand what the data is conveying will it become useful. While we all have the capability to crunch numbers in our trusted Excel spreadsheet, true data analysis is a real skill, and to analyse this data correctly particularly in regard to overcrowding, service utilisation, defining origin-destination pairs, requires a skilled data scientist. In a lot of cases an authority will collect vast quantities of data, but unless there is a defined need, this is rarely analysed in any real depth, except perhaps for reasonably rudimentary counts.
In order to deliver service and network wide improvements we need to better understand the data, the cause and effect of making a change, which in turn could require some transport modelling skills, the point is the more you assess, utilise and analyse the data the more benefits your group, authority or region is likely to be able to extract from the data that is available.
It is therefore suggested that your DMP should be the cornerstone of your long-term traffic and transport optimisation model that will demonstrate an ongoing commitment for transport improvement in your region.
The Next Paper – The last in This Series – Conclusions and Lessons Learnt
The next article will concentrate on providing a broader list of lessons learnt from the delivery of perhaps the first successful DMP in the UK.
Jorgen Pedersen – Gooii TX Chief Operating Officer, has delivered perhaps a dozen journey planners both in the UK and abroad, encompassing modal shift, first-mile / last mile solutions, micro mobility, many of which have won awards for best in class, He has been responsible for the delivery of a number of ticketing solutions encompassing Account Based Ticketing (ABT), Contactless, Eurocard, Mastercard, Visa (cEMV), fare capped solutions, gate line integrations, and has been responsible for the implementation of a number of payment solutions. Some of which have been delivered as far away as Australia, Canada, America and even Japan. He has also designed passenger facing autonomous vehicle solutions for a busy international airport which are currently in operation. He has a systems engineering, software development, mechanical and mathematical background, providing a foundation for technical program design and delivery.