Data Visualisations For Medical Research
Jisc partners with Gooii to create data visualisations website UI for Medical Research.
Jisc are the UKs higher education (HE) and further education (FE) teaching, learning and research institution. They provide UK universities and colleges with shared digital infrastructure. This includes the super fast Janet fibre optic 400gbits/second network. Jisc inspire and drive the UK to be the most digitally advanced education and research nation in the world. They negotiate with publishers on behalf of the UK higher education sector to procure and license affordable digital content. Jisc commissioned Gooii to help with their data visualisations website UI development.
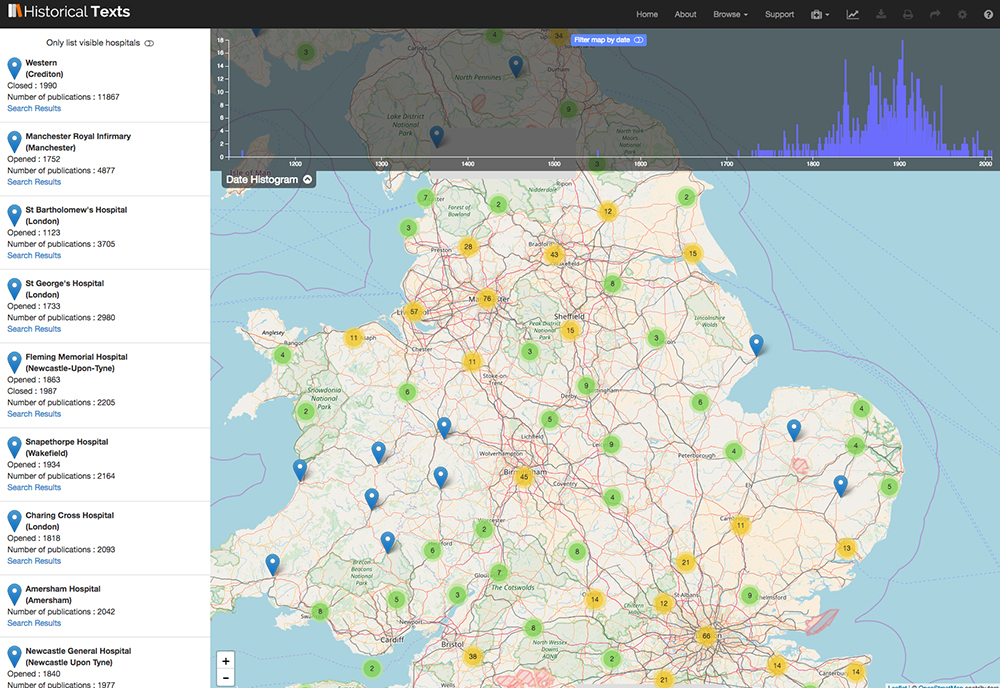
The database is managed by the team at Knowledge Integration in Sheffield. Gooii’s Nottingham office have worked as technology partners with them on many projects previously within the education and heritage sectors. Gooii were the natural choice for this website data visualisation UI work. The brief was to create a set of data visualisations to show large and complex data sets in a clean and concise way. The UI was also required to provide a set of filtering tools specifically targeted to the data set being analysed.
As you can see from the imagery, the vast data sets have been presented in a simple yet powerful user interface. This allows users to easily filter, display and understand their data despite its size. The map allows the user to drill down into data that is shown grouped where large number of results exist.
Once the data selection is complete the user can then collate and present their research logically to their audience. The UI supports desktop, tablet and mobile devices.